KNA COOPERATED WITH TUV AUSTRIA HELLAS ON AUDITING FSC STANDARDS IN VIETNAM
After time of exchanging and discussing, KNA CERT has successfully signed a cooperation agreement with TUV Austria on FSC/CoC certification services. Accordingl...

After World War II, Japanese companies had to run into numerous difficulties. Japan Association of Engineers decided to design statistical tool systems in quality management for all classes of Japanese ministries. In addition to Kaizen ideology, this toolkit is called 7 quality management tools used commonly in the world.
We can confirm that the improvement in quality will not be effective if statistical tools are not applied. However, there are up to thousands of statistical tools, it's necessary for enterprises to apply an appropriate tool with a view to achieving the highest efficiency.
Thanks to stastical and quality management tools, Japanese experts who have much experience can solve most of problems in quality management and production activities as well as service.
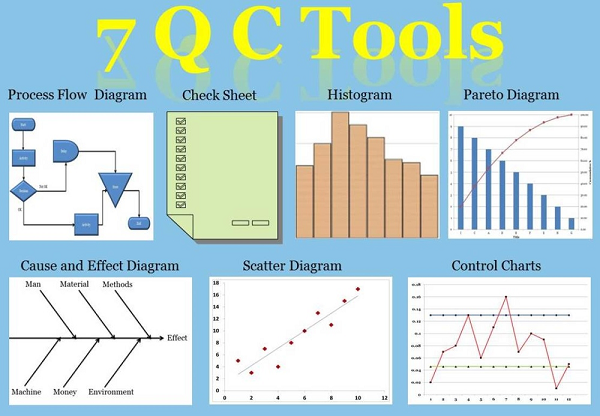
7 main tools are:
There are some tools early applied such as Check Sheets has been applied since World War II while Pareto and Control Chart since the beginning of 20th century. Cause & Effect Diagram was invented by Ishikawa, the rest of tools were gathered, researched and applied.
This is a simple storage medium for necessary data statistics, which helps enterprises to determine the order of priority in events. Check Sheets can be a form of record of past activities. This is also a means of tracking that allows you to notice the trend objectively.
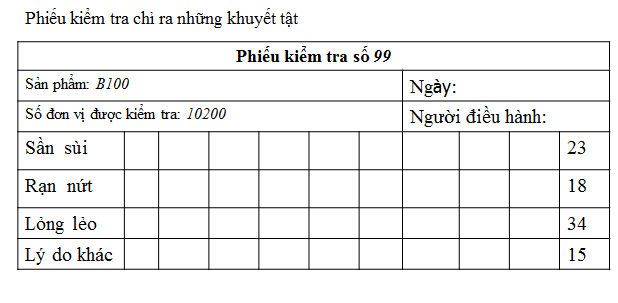
Check Sheets are used for:
- Control data distribution of an indicator in production.
- Supervise jobs.
- Find the causes of faulty products.
- Identify types of disability.
- Check defect locations.
The collection of check sheets will help to supervise events in chronological order or location. Afterwards they can be used as input data of Pareto Chart. For example, in terms of issues such as numbers of overflow/month, maintenance call / week, gathered harmful waste / working hours, etc.
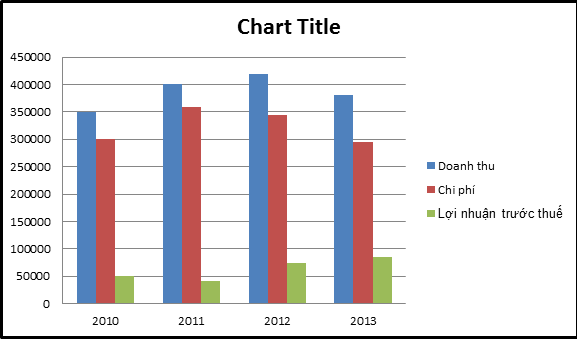
There are various charts: Line chart, Column and Line Chart, Pie Chart, Bar Chat, Gantt Chart, Spider Web Chart.
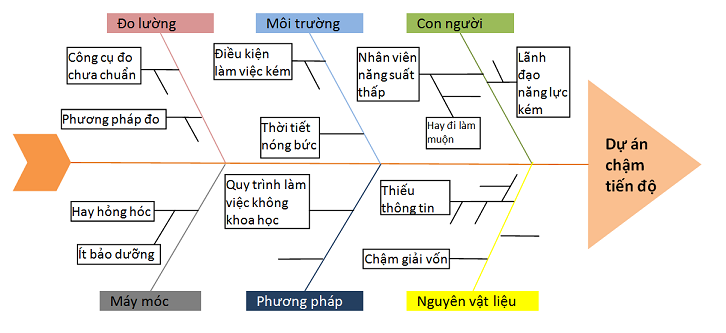
Goals: Cause & Effect Diagram will help to detect causes quickly. Managers can take precautions and corrective actions for quality assurance. This is one of the most common tools in the discovery of causes and disabilities in production. Lean 6 Sigma pre-audit and practice courses usually apply this chart.
This tool is used for doing research, preventing potential threats. Fishbone, Ishikawa Chart or Tokuzei Yoin in Japanese are different names of this chart.
Characteristics of this chart is to help us make a list then categorize potential causes but not give a method of eliminating it.
4. Pareto Analysis
Pareto's introduction
The fourth tool which also play a vital role is Pareto Chart (Pareto Analysis). This is one of charts used to allow administrators to classify important causes. This chart use helps managers determine causes that should be solved.
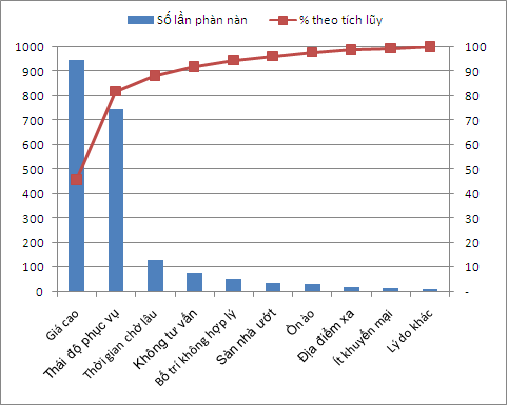
Goals: Pareto Chart will help administrators sort out important reasons to determine priorities for key issues. Pareto Chart helps to assess improvement efficiency.
Applicable Issues: Analyze data relating to decide which important factor is will affect that issue.
Pareto analysis also plays an important role in improvement. Consequently, improvement needs carrying out with some statistical tools.
In quality management, we can see that:
This is a simple column chart. They help to aggregate data to show the frequency of events.
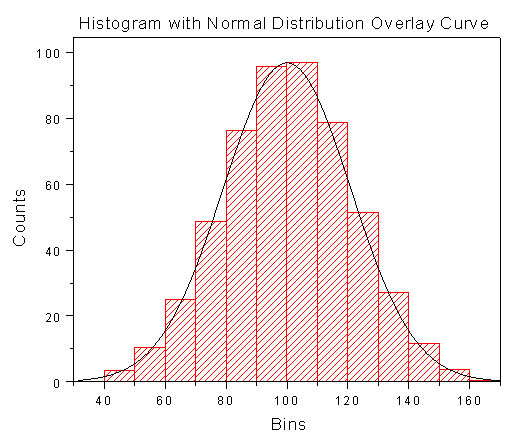
Histogram's goal is to supervise the distribution of product and process parameters. Then, the capacity of process will be assessed (Whether process can meet requirements of production or not?) A line chart indicates problem appearance frequency (collected through check sheets).
Application: Take precautions before problems occur.
6. Scatter Diagram
Introduction of Scatter Diagram
Scatter Diagram is a data representation through graph. More specifically, noticeable values of one variable are plotted in points to values of the other without connecting points with a line. Scatter Diagram shows the relationship among 2 factors.
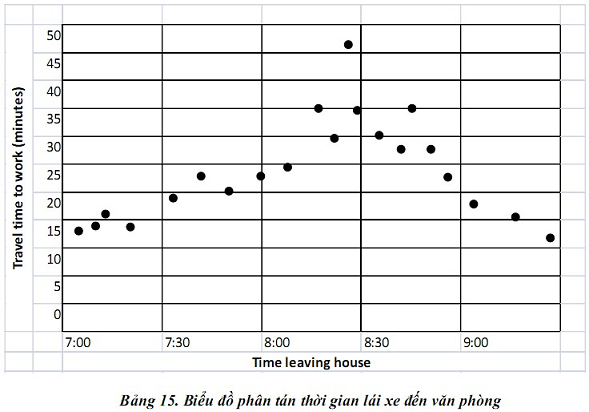
Scatter Diagram's goal is to tackle problems and determine optimal conditions by analyzing cause and effect relationship among variables of 2 factors.
Chart analysis can help to discover how one factor is dependent on another and the degree of dependence among them.
7. Control Chart
Introduction of Control Diagram
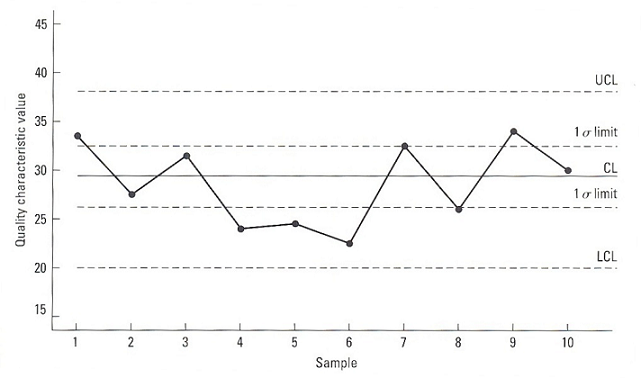
Control Diagram is a chart with limited lines calculated by statistical method with the aim of supervising the fluctuation of parameters concerning quality characteristics of products, following changes of process to control all risks when there is an up or down sign of chart.
Control Chart's goal is to detect unusual situations in production.
Please contact with us for ISO 9001 Pre-audit- certification.
After time of exchanging and discussing, KNA CERT has successfully signed a cooperation agreement with TUV Austria on FSC/CoC certification services. Accordingl...

At the beginning of November 2022, SZU started negotiations with its Vietnamese partner, KNA CERT Certification Co., Ltd. After that, the two parties reached an...

Thanks to their application of Food Safety Management model according to ISO 22000, Bao An Trading and Service Investment and Development JSC minimized their co...
KNA experts assessed and Pre-audit FCCA - SCS according Wal-Mart for the staff of Parosy JSC in charge of manufacturing textile apparel on the scale of nearly 3...
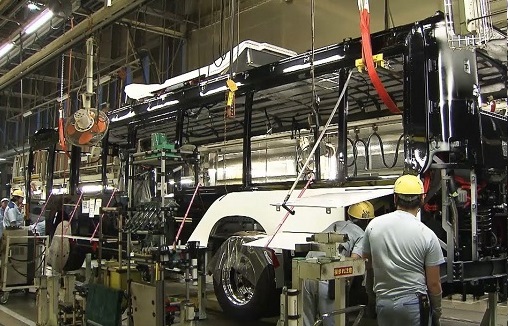
Daewoo Vietnam Bus Co., Ltd belongs to Daewoo Korea Group, a unique bus and coach production and assembly enterprise with 100% foreign investment in Vietnam.